
High-frequency electrical systems rarely produce one perfectly steady frequency. Switching circuits create a fundamental rate and harmonics, while spark gaps generate short impulses followed by damped ringing across a broad spectrum. To understand a High Frequency Plasma generator, we must therefore measure more than one number.
Lesson 23 of 24 — High Frequency Plasma Learning Centre
An oscilloscope shows how voltage or current changes with time. A spectrum analyser shows how signal energy is distributed across frequency. Near-field probes allow safer, non-contact comparisons around high-voltage equipment, while counters and meters have more specialised roles.
This lesson explains how high frequencies are measured, what the different instruments reveal, how to interpret peaks and harmonics and how Alan’s tinySA can be used for repeatable non-contact observations without connecting it to the generator’s high-voltage circuit.
What You’ll Learn
By the end of this lesson, you will understand:
- the difference between time-domain and frequency-domain measurements;
- how frequency is calculated from a waveform period;
- why a spark-gap signal contains many frequencies;
- what oscilloscopes, spectrum analysers and frequency counters measure;
- how bandwidth, sample rate, span and resolution bandwidth affect results;
- the difference between E-field and H-field pickup probes;
- what dBm means—and what it does not mean with an uncalibrated antenna;
- how to use MAX HOLD and markers responsibly;
- how to create repeatable measurements around the plasma generator;
- and why measurement safety is as important as the reading.
The Short Answer: How Are High Frequencies Measured?
High frequencies are measured by converting rapid electrical or electromagnetic changes into a display that can be counted or analysed.
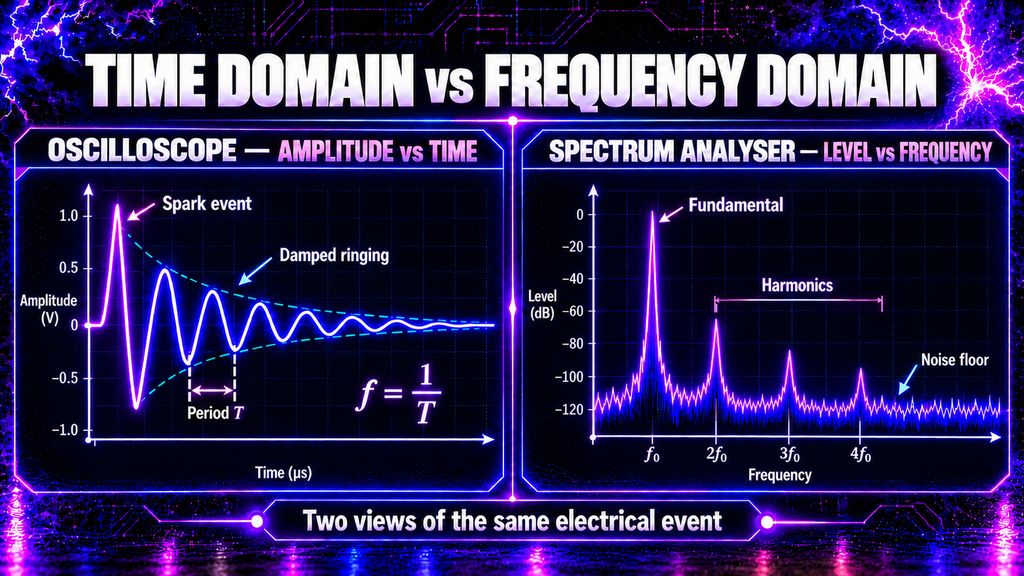
For a repeating waveform, frequency is the inverse of its period:\[ f=\frac{1}{T} \]
If one cycle takes 10 microseconds, the frequency is:\[ f=\frac{1}{10\times10^{-6}}=100\text{ kHz} \]
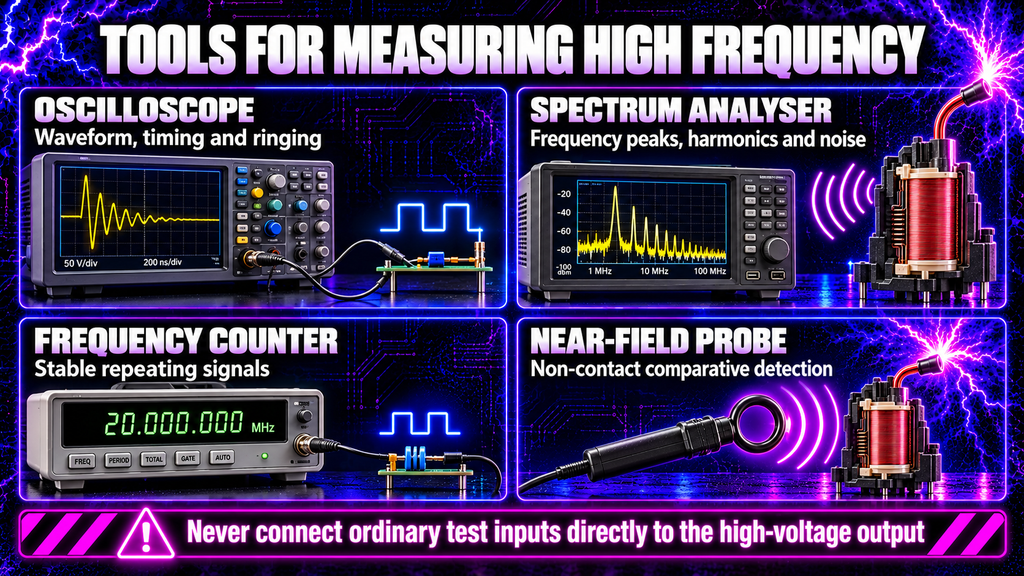
An oscilloscope can measure that period directly. A spectrum analyser instead separates a complex signal into frequency components and displays their relative strength. A frequency counter counts stable cycles crossing a threshold.
A spark-driven plasma generator is more complex: it has a ZVS switching rate, a spark repetition rate and a damped high-frequency oscillation after each spark. These are related, but they are not the same measurement.
Frequency Is Only Part of the Story
Two signals can share the same fundamental frequency yet behave very differently. A sine wave contains mainly one frequency. A square wave with the same repetition rate contains the fundamental plus odd harmonics. A narrow pulse contains an even broader spectrum.
A spark gap produces a rapid transition. The capacitor bank and circuit inductance then exchange energy, creating a damped oscillation whose amplitude falls after each discharge. Wiring, capacitance, inductance, resistance, the bulbs and the spark itself shape the waveform.
Useful questions include:
- How often does the ZVS current alternate?
- How often does the spark gap fire?
- At what frequency does the output ring after each spark?
- Which harmonics or sidebands are present?
- How strong is a detected component relative to an earlier test?
- Does the behaviour remain stable as the equipment warms?
One reading labelled “frequency” cannot answer all of these.
Time Domain Versus Frequency Domain
Time domain
An oscilloscope plots amplitude vertically and time horizontally. It reveals waveform shape, period, rise time, pulse width, ringing, timing relationships and intermittent events.
It is ideal for seeing whether a signal is sinusoidal, square, pulsed or damped. It can also show the time between individual spark events.
Frequency domain
A spectrum analyser plots signal level vertically and frequency horizontally. Peaks reveal a fundamental, harmonics, sidebands and unwanted emissions. The noise floor shows the background below which weaker components become difficult to distinguish.
These views describe the same physical event differently. A short pulse in the time domain may appear as energy spread over many frequencies in the frequency domain.
Which Instrument Should Be Used?
| Instrument | Best for | Main limitation |
|---|---|---|
| Oscilloscope | Waveform shape, period, pulse width, ringing and timing | Requires suitable bandwidth, sample rate and correctly rated probes |
| Spectrum analyser | Fundamental frequencies, harmonics, noise and relative signal strength | Does not directly show when each event occurred unless special time functions are available |
| Frequency counter | Accurate counting of clean, stable periodic signals | Can give unstable or misleading results with bursts, noise and multiple crossings |
| Near-field probe | Non-contact detection and locating emissions | Usually comparative unless the probe and setup are calibrated |
| Current probe | Current waveform without inserting a shunt | Bandwidth, conductor position and maximum current limit accuracy |
| LCR meter | Inductance, capacitance, resistance and component resonance tests | Does not measure the complete powered generator’s emitted spectrum |
No single instrument is best for every question. Professional investigation often combines an oscilloscope and spectrum analyser with appropriate probes.
Measuring with an Oscilloscope
The oscilloscope is the clearest way to see the generator’s timing, but choosing the instrument is not just a matter of maximum MHz.
Bandwidth
Bandwidth is the highest sine-wave frequency the oscilloscope can display before its measured amplitude has fallen by 3 dB, or to about 70.7% of the real value. Fast pulses contain components well above their repetition rate, so a scope that barely covers the fundamental can hide sharp edges and ringing.
A common rule is to use a measurement system with several times the bandwidth of the highest frequency of interest. The probe, cable and oscilloscope input all form part of that system.
Sample rate
Sample rate is how many measurements the digitiser takes each second. Nyquist theory gives an absolute minimum of more than twice the highest frequency component, but practical waveform reconstruction usually requires substantially more samples.
Too low a sample rate causes aliasing: a fast signal may appear as a slower, believable but false waveform.
Trigger and record length
The trigger tells the oscilloscope when to capture. Edge triggering can stabilise a repeating waveform; single-shot triggering can catch one spark event. Record length determines how long the instrument can observe while retaining fine time detail.
Capturing both a brief ringing burst and a longer sequence of spark events requires a suitable balance of sample rate, time span and memory.
Oscilloscope Probe Safety
A standard bench oscilloscope’s ground clip is usually connected to protective earth. Attaching it to a floating, switched or high-voltage node can create a short circuit through the oscilloscope, damage equipment and expose the operator to dangerous current.
High-voltage work may require a correctly rated differential probe, high-voltage probe, isolated instrument or current probe. Its working voltage, transient rating, bandwidth, creepage and category must suit the actual circuit.
Never place an ordinary 10:1 probe directly on the flyback output, capacitor banks, spark gap or bulb wiring. Voltage can exceed the probe rating, and sharp transients may be more damaging than the apparent average value suggests.
For general learning and comparison, non-contact pickup methods are much safer than direct electrical connection—but distance and insulation must still prevent accidental flashover.
Measuring with a Spectrum Analyser
A spectrum analyser displays received power versus frequency. The most important controls are:
Centre frequency and span
Centre frequency is the middle of the display. Span is the total frequency range shown. Begin with a wide span to find activity, then narrow it around a peak to inspect detail.
Reference level and attenuation
The reference level sets the top of the amplitude display. Input attenuation protects the analyser and reduces overload. Starting with greater attenuation or greater distance is safer when signal strength is unknown.
Resolution bandwidth — RBW
RBW determines how well nearby frequency components can be separated. Narrower RBW improves frequency resolution and lowers displayed noise, but makes a sweep slower. Wider RBW sweeps faster but may merge close peaks.
Video bandwidth — VBW
VBW smooths variations in the displayed trace after detection. Reducing it can make a noisy trace easier to read, but it may conceal rapid changes.
Markers and peak functions
A marker reports the frequency and displayed level at a chosen point. Peak search finds the highest visible component. MAX HOLD retains the largest value seen at each frequency bin during repeated sweeps, which is useful for intermittent spark emissions.
MAX HOLD does not mean that every retained peak occurred simultaneously. It is a history of the highest level seen at each frequency.
Understanding the tinySA
The original tinySA provides a low input covering approximately 100 kHz to 350 MHz and a high input covering approximately 240 MHz to 960 MHz. Its two ranges behave differently, so the correct input and frequency range matter.
The official specification lists an absolute maximum input of +10 dBm without internal attenuation and recommends no more than +0 dBm when automatic attenuation is used. These are small RF power levels. The tinySA is not a high-voltage meter and must never be connected directly to the generator’s flyback, capacitor banks, spark gap or bulb output.
Strong signals can overload the analyser and create false peaks through compression, harmonics or intermodulation. The high-frequency input also has no input band filter, so powerful signals outside the displayed range may distort what appears on screen.
If moving the pickup farther away does not make the displayed signal fall sensibly, or a forest of new peaks appears suddenly, overload is a possibility.
Antenna Versus Pickup Coil
A telescopic antenna responds mainly to electric-field coupling and surrounding radio transmissions. It is useful for a broad survey, but it may also display broadcast, mobile, Wi-Fi and other environmental signals unrelated to the generator.
A loop or pickup coil responds mainly to a changing magnetic field. Its output depends strongly on:
- loop area and number of turns;
- distance from the source;
- orientation;
- frequency response;
- cable routing;
- and any shielding or termination.
A larger loop usually gives more sensitivity, while a smaller loop offers better spatial resolution. Rotate the loop while watching the trace: the reading should change as magnetic flux passes through the loop at different angles.
Unless the probe, cable and analyser have been calibrated together, the displayed dBm value is best used for relative comparison, not as an absolute field-strength measurement.
What Does dBm Mean?
dBm expresses power relative to 1 milliwatt:\[ P_{dBm}=10\log_{10}\left(\frac{P}{1\text{ mW}}\right) \]
Therefore, 0 dBm equals 1 mW at the analyser input, −10 dBm equals 0.1 mW and −30 dBm equals 0.001 mW.
With a properly matched 50-ohm cable and calibrated source, dBm can describe input power. With a loose antenna or homemade pickup coil, the analyser still reports the power arriving at its input—but not automatically the electric or magnetic field strength beside the generator.
A change from −50 dBm to −40 dBm represents ten times the received power, provided the same probe, distance, orientation, settings and environment were used.
A Repeatable tinySA Measurement Method
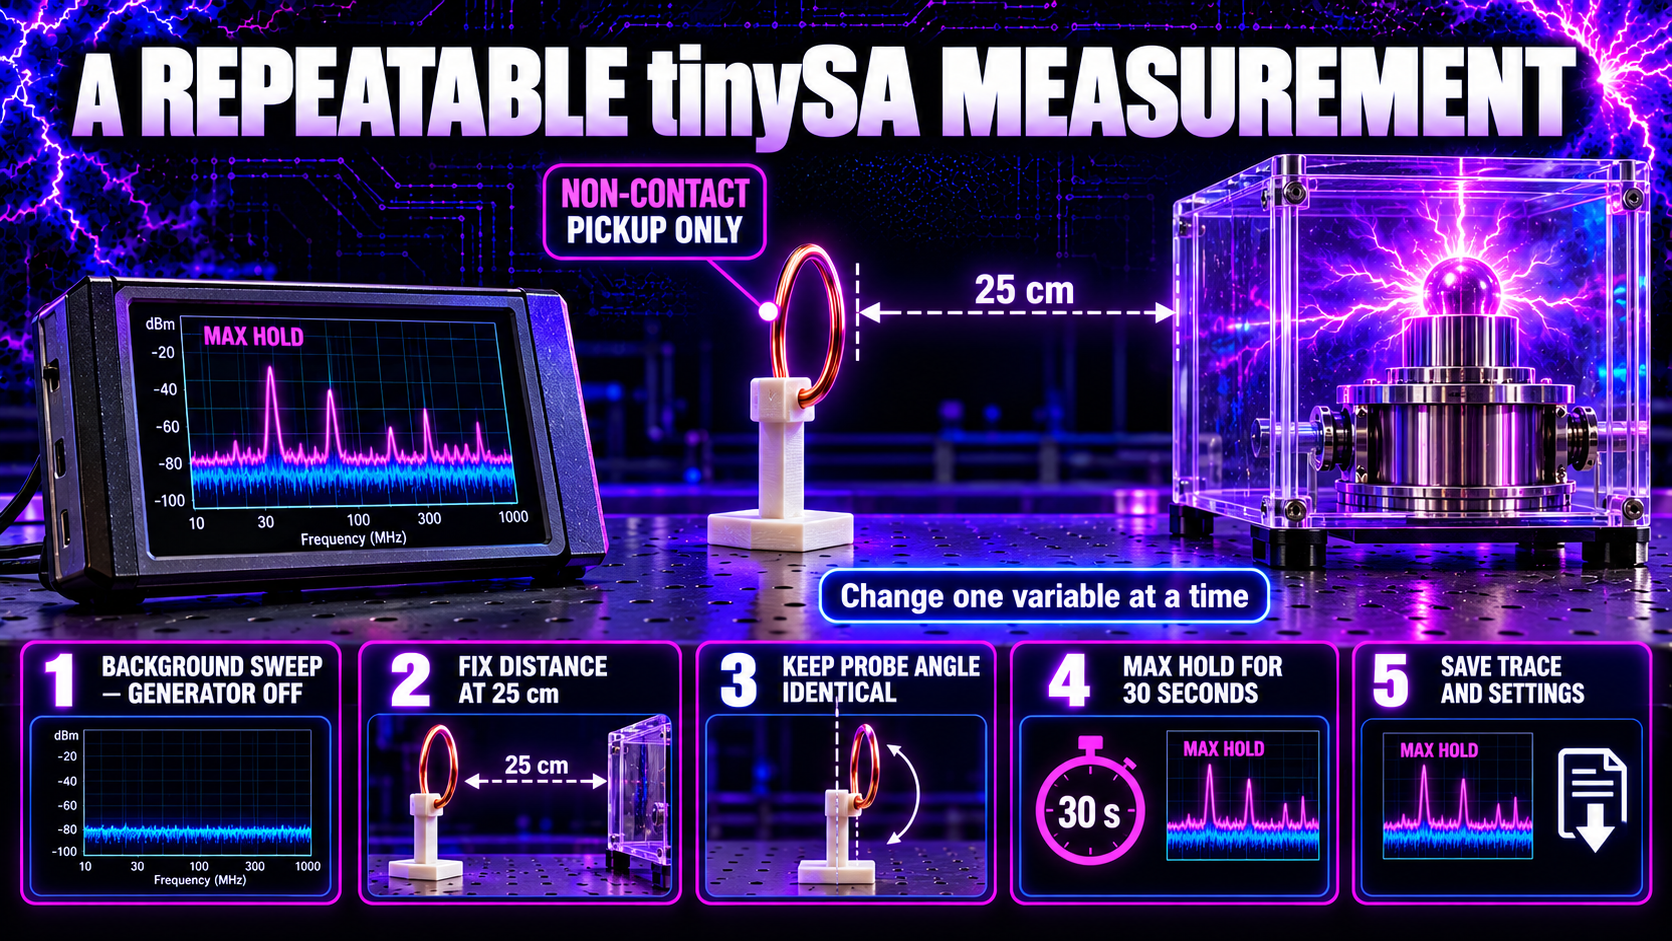
For comparative checks around the plasma generator:
- Record a background sweep. With the generator off, note existing radio signals and the noise floor.
- Fix the test geometry. Position the antenna or pickup coil 25 cm from the same reference point using a non-conductive stand.
- Keep orientation identical. Mark the probe angle and cable route; small changes can alter coupling greatly.
- Start conservatively. Use a wide span, sufficient attenuation and greater distance if strength is unknown.
- Power the generator remotely. Keep people, instrument cables and sensitive electronics away from the high-voltage area.
- Use MAX HOLD for 30 seconds. This captures intermittent maxima across multiple spark events.
- Place markers on genuine peaks. Compare them with the background trace and look for harmonically related spacing.
- Narrow the span carefully. Inspect a chosen region with a smaller RBW, remembering that settings change sweep time and displayed noise.
- Save the screenshot and settings. Record input, centre/span, RBW, attenuation, distance, orientation, gap setting and test duration.
- Change one variable at a time. Altering distance, spark gap, supply or probe simultaneously makes the result difficult to interpret.
This produces repeatable comparisons between builds or adjustments. It is not a certified electromagnetic-emissions test.
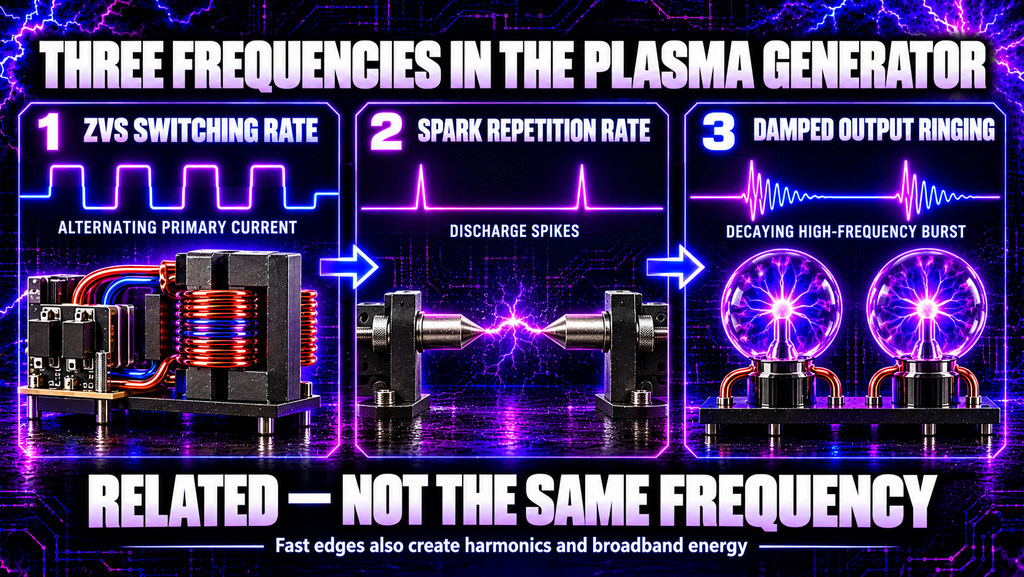
What Frequencies Exist in the Plasma Generator?
ZVS switching frequency
The resonant driver alternates current through the balanced flyback primary. Its switching rate depends on the resonant network, flyback loading, supply and component values. It can be examined at the low-voltage stage with suitably isolated voltage or current measurement methods.
Spark repetition rate
The capacitor banks charge until the zinc gap breaks down. The number of discharge events per second is the spark repetition rate. It is normally much slower than the oscillation within each pulse and can vary with gap distance, voltage, humidity and electrode condition.
Output ringing frequency
When the gap fires, capacitor-bank energy enters the inductive output network. Capacitance and inductance create a damped oscillation. A simplified resonant estimate is:\[ f_0=\frac{1}{2\pi\sqrt{LC}} \]
Real wiring has distributed capacitance, inductance and resistance, so multiple modes may occur.
Harmonics and broadband energy
Fast switching edges and sparks add harmonics and broadband components. A spectrum trace may therefore show many peaks even though the circuit has only one principal switching oscillator.
Reading a Spectrum Correctly
A tall peak marks a strong component at the analyser input, not necessarily the generator’s “main healing frequency” or its greatest power-delivery frequency.
Check whether peaks:
- disappear when the generator is off;
- change logically with distance;
- remain at the same frequency across repeated tests;
- occur at integer multiples of a lower fundamental;
- move when one circuit setting changes;
- or remain unchanged because they come from local radio services.
The noise floor is equally important. A weak real component may be hidden below it. Reducing RBW, averaging or using a suitable probe may reveal it, but excessive analyser gain can also create overload products.
Screenshots should always include settings. A trace without span, RBW, attenuation, input and probe geometry cannot be compared reliably.
Common Measurement Mistakes
- Treating the strongest spectrum peak as the only frequency present.
- Confusing spark repetition with high-frequency ringing.
- Comparing readings taken at different distances or probe angles.
- Ignoring the background spectrum.
- Assuming an antenna reading is calibrated field strength.
- Using MAX HOLD without stating the collection time.
- Choosing an RBW too wide to separate close peaks.
- Mistaking aliasing or analyser overload for a real signal.
- Connecting an earth-referenced probe to a floating high-voltage node.
- Exceeding an instrument or probe’s voltage, power or transient rating.
Good measurement is a controlled experiment, not merely a number on a screen.
Measurement Safety
Keep test equipment outside the arc and flashover region. Use non-conductive probe supports and maintain generous clearance from the flyback lead, capacitor banks, spark gap and output wiring.
Never hold an antenna or pickup coil close to the operating spark gap by hand. Unexpected arcs can bridge farther than anticipated, and conductive probe cables can carry energy back to the instrument or operator.
Capacitors may remain charged after shutdown. Isolate the supply, use a designed discharge system and prove the circuit dead with correctly rated equipment before moving probes or altering wiring.
The generator is not medical equipment. Do not use it if pregnant or with a pacemaker or other implanted electronic device, and keep it away from TVs, laptops, computers, phones and other sensitive electronics.
Frequently Asked Questions
Can a multimeter measure high frequency?
Most general multimeters have limited frequency range and may misread non-sinusoidal, pulsed or high-voltage signals. Check the meter’s bandwidth, input rating and waveform limitations.
Is the highest tinySA peak the generator’s operating frequency?
Not necessarily. It could be a harmonic, environmental transmission, resonance in the pickup setup or an overload product.
Why does rotating the pickup coil change the reading?
The induced voltage depends on how much changing magnetic flux passes through the loop. Orientation changes that linkage.
What does MAX HOLD show?
It stores the highest level observed in every frequency bin over successive sweeps. Peaks may have occurred at different times.
Can I connect the tinySA directly to the bulb wires?
No. Its input is designed for low-power RF signals, not the generator’s high-voltage pulses.
Why do I see frequencies when the generator is off?
The antenna detects surrounding radio services, digital electronics and background noise. An off-state sweep helps identify them.
Is a frequency counter useful for spark-gap output?
Only with suitable conditioning. Multiple threshold crossings and bursts can make a counter display unstable or misleading values.
What Have We Learned?
High frequency can be measured in the time domain with an oscilloscope or in the frequency domain with a spectrum analyser. The oscilloscope reveals waveform shape and timing; the spectrum analyser reveals frequency components and their relative levels.
The plasma generator produces several distinct behaviours: ZVS switching, spark repetition and damped output ringing. A tinySA with an antenna or pickup coil can compare emitted spectra safely when distance, orientation and settings remain constant, but it must never be connected directly to the high-voltage output.
🧠 Key Takeaways
- Frequency is the inverse of period: \(f=1/T\).
- Complex waveforms contain a fundamental, harmonics and broadband energy.
- An oscilloscope displays amplitude versus time.
- A spectrum analyser displays received level versus frequency.
- Bandwidth and sample rate determine whether fast details are captured.
- Low sample rate can create aliasing.
- RBW trades frequency resolution against sweep speed.
- MAX HOLD records the maximum in each frequency bin over time.
- Antennas and pickup coils respond to different field components.
- Uncalibrated near-field readings are best for relative comparison.
- The ZVS switching rate, spark repetition rate and output ringing are different.
- Never connect ordinary RF or oscilloscope inputs directly to the generator’s high-voltage circuit.
Continue Your Learning Journey
Previous Lesson: Lesson 22 — How Does a Flyback Transformer Work?
Next Lesson: Lesson 24 — How Does the Complete High Frequency Plasma Generator Work? (Coming Soon)
Further Reading
- tinySA — Original tinySA specifications
- Tektronix — Evaluating oscilloscope bandwidth and sample rate
- Keysight — Spectrum Analyzer Basics
- Rohde & Schwarz — How to choose and use a near-field probe
Learn More About High-Frequency Plasma
Explore the complete High Frequency Plasma Learning Centre at HighFrequencyPlasma.com.
Join the Telegram community: https://t.me/HighFrequencyPlasma
Disclaimer
This lesson is for general educational purposes. High-frequency, high-voltage and capacitor-discharge systems can cause fatal electric shock, severe burns, fire, component rupture and electromagnetic interference.
Do not connect, probe, modify or operate high-voltage equipment unless you are competent and use correctly rated isolation, enclosures, interlocks, discharge systems and test instruments. This generator is not medical equipment and is not intended to diagnose, treat, cure or prevent any condition.
🎉 Lesson Complete
You now understand why high-frequency measurement requires both time-domain and frequency-domain thinking, how to make repeatable non-contact observations and how to avoid confusing switching, sparks and ringing.
In Lesson 24, we will bring the entire Learning Centre together and follow energy through every stage of the complete High Frequency Plasma generator.